
Visualization |
|
|---|
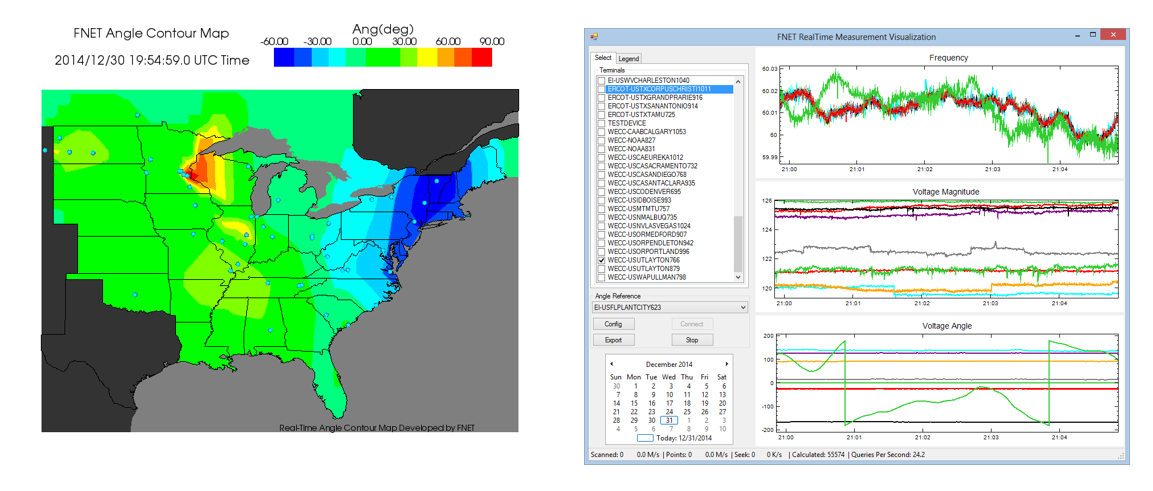
Power system operators rely upon phasor measurement data to assess the state of the grid. The volume of data obtained from these devices is quite large, which can make it difficult to quickly interpret. The Power IT Lab has developed intuitive displays of frequency and angle measurements using real-time FNET/GridEye data in both space dimension and time dimension.
References
[1] Y. Zhang, L. Chen, Y. Ye, P. Markham, J. Bank, J. Dong, Z. Yuan, Z. Lin, and Y. Liu, Visualization of wide area measurement information from the FNET/GridEye system, in 2011 IEEE Power and Energy Society General Meeting, 2011, pp. 18.