
Superbowl Frequency Swings |
|
|---|
This work investigates the NFL Super Bowl games as an example of evaluating the influence of synchronized human activities on the power system using data collected from a wide-area frequency monitoring network (FNET/GridEye).
A. Observation 1: High density of frequency events during broadcasting period
The FNET/GridEye event trigger is set at 400 MW. Typically, the Eastern Interconnection has no more than 4 events per day. However, no four-hour period in all the recorded events experience as many events as there are during the Super Bowl.
B. Observation 2: Frequency events tend to happen during commercial breaks
During regular commercial breaks, the viewers are more likely to engage in other activities besides watching TV, such as using the restroom, getting food or beverages from the refrigerator, using a computer, stove, microwave, clothes dryer and washer or other home appliance. Most of these activities involve the use of electricity. The increased energy consumption explains why multiple grid frequency events occur during the commercials.
C. Observation 3: Large frequency fluctuation during halftime break
The general impact on the system is relatively larger during the half-time break due to a longer period of break time and an increase in viewership. Figure below shows a 30 minute frequency plot comparing an ordinary Sunday evening in late January versus the half-time break of Super Bowl XLVII.
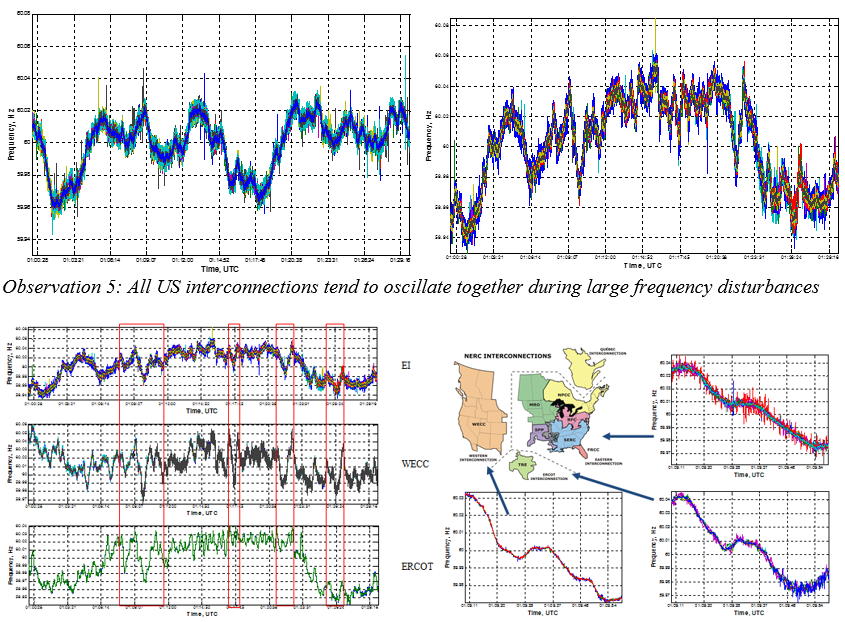
It can be seen from the plots that the impacts of nationwide events are also reflected in interconnections other than EI. These are very unique frequency signatures can only be observed during Super Bowl game time, since EI, WECC and ERCOT are not synchronized interconnections.