
FIDVR Detection and Analysis |
|
|---|
In recent years, the phenomenon of Fault-Induced Delayed Voltage Recovery (FIDVR) has increasingly been observed and has attracted attention as a significant issue in power systems [1]-[2]. A descriptive plot of FIDVR is shown in Figure 1. In Figure 1, the depressed voltage is observed just after the fault is cleared and the voltage recovery time varies in seconds to tens of seconds, typically. The initial depressed voltage represents a relatively long period in which the voltage is not controlled. There is justifiable concern that this behavior could directly lead to a widespread outage or leave the system vulnerable to a significant outage as the results of another disturbance. Fault-induced delayed voltage recovery is not a new phenomenon. In regions with a high percentage of air conditioner loads, the problem persists. More recent events have been presented in references [1]-[2].
The purpose of FIDVR detection and analysis is to look for past events of FIDVR from phasor measurement units and frequency disturbance recorders (PMUs/FDRs) measurement data. The study results could help provide guidance on where to install FDRs that may help narrow down the search. FIDVR events detection trigger which plays an essential role in the signature, and contains two major factors:
Factor.1: Maximum voltage sags in percentage. As PMUs data are for high voltage buses and transmission lines but FIDVR events occur in the distribution network, voltage sag for FIDVR detection should be chosen carefully to avoid some voltage fluctuation and maintain the sensitivity of detection. The maximum voltage sag (%) is defined by
![]()
In (1), Vi is the voltage of PMUs/FDRs data and N is the total number of PMU/FDR data. For example, according to (1), the maximum voltage sag within 10 cycles is calculated for PMU and 30 cycles for FDR.
Factor.2: Duration. Duration shown in Figure 1 is also another important factor for FIDVR detection and voltage dips with long enough duration are potentially regarded as FIDVR events by the trigger.
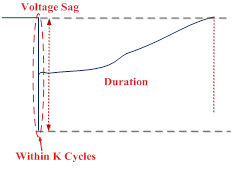
Figure 2 Events detection trigger
Voltage data of 101 TVA PMUs in 2005-2012 Summers, and all the FDRs in 2004-2013 Summer were fed through the FIDVR trigger [2]. Over 170, 000 voltage dip signatures have been found. No specific FIDVR event has been conformed from the PMU/FDR data so far, but after introducing an automatic pattern recognition algorithm to classify different patterns by their voltage waveforms, some FIDVR like events were detected. We recommend installing more PMU and FDR units to increase the resolution of detection for power system transient responses.
References
[1] Zhuohong PAN, Jidong Chai and Yilu Liu, "Fault-Induced Delayed Voltage Recovery Detection Using PMUs and FDRs Measurement Data", in Advanced Grid Modeling 2014 Peer Review, 2014 AGM, April 2014, Knoxville, Tennessee, USA.
[2] Zhuohong PAN and Yilu Liu, "Fault-Induced Delayed Voltage Recovery Detection from Historical PMU and FDR Measurement Data", technical report, 2014.